Last week I wrote a post on this remarkable graph from the Department of Energy (DOE), which I deemed the chart of the year — clear evidence of the rapid cost declines driving the ongoing clean energy revolution.
Now you might think that anyone looking at this chart would see the incredible story it tells, especially since it comes from the newly-released update of a DOE report titled, “Revolution…Now: The Future Arrives for Five Clean Energy Technologies.”
But you are forgetting the media’s ability to spin gold into straw. The New York Times in particular has been dissing and misrepresenting the clean energy revolution for a while now. Still, even I was surprised when someone pointed out this tweet from Times climate blogger, Andy Revkin:
With renewable @energy cost drops flattening. https://t.co/pBVRA040ak glad @ErnestMoniz pressing deploy AND rd&d https://t.co/Pv20DLCfFb pic.twitter.com/cq4aKOlBgk
— Andy Revkin (@Revkin) September 28, 2016
The thing is, this chart does not show “renewable energy cost drops flattening,” as Revkin asserts. That is the most clear in the curve of “utility-scale PV” (photovoltaics).
In fact, as Bloomberg New Energy Finance (BNEF) and others have been explaining to the media and public for quite some time, these price drops are projected to continue since they represent a learning curve, whereby more deployment leads to more price drops.
But because the price drops have been so rapid — 94 percent in seven years for LED bulbs alone — it can be a little harder to see on this kind of chart.
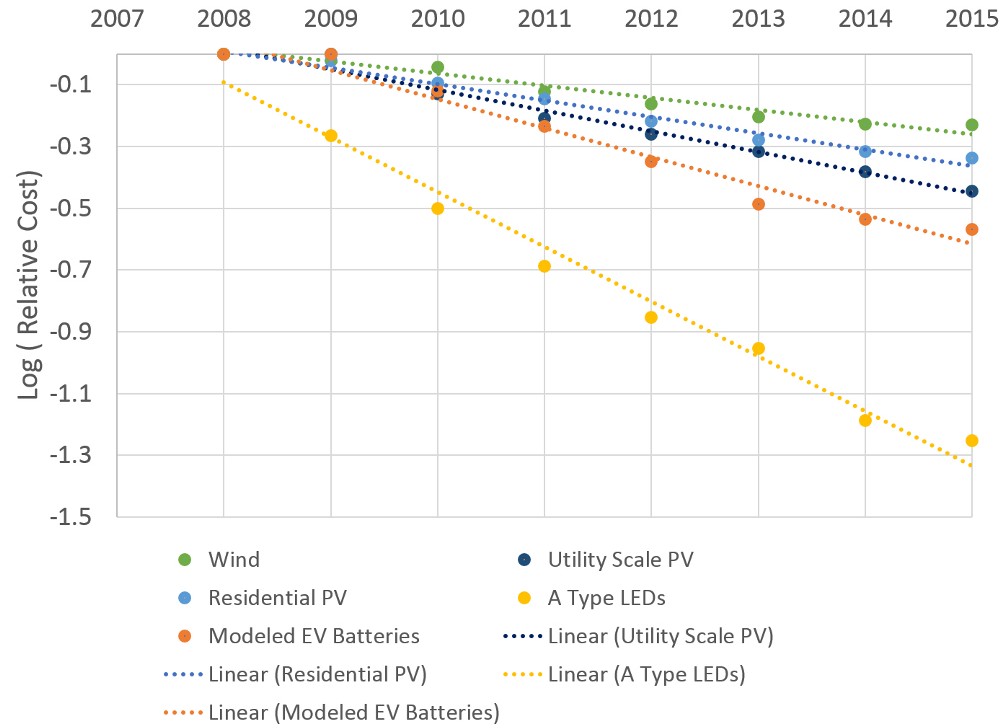
That, of course, is precisely why BNEF and others generally use a different kind of chart for learning curves, one that uses a logarithmic (or semi-log) plot to visualize exponential trends. As it turns out, the scientist who blogs under the name Eli Rabett, got the original data from DOE so he could re-plot it on an appropriate scale.

This makes it much clearer that the trends are not “flattening.”
Again, this is no surprise. The International Energy Agency released a whole report on this subject back in 2000, titled, “Experience Curves for Energy Technology Policy.” In it, the IEA explained that accelerated clean energy deployment policies were creating economies of scale and bringing technologies rapidly down the learning curve. As long as those policies continue, the price drops would continue.
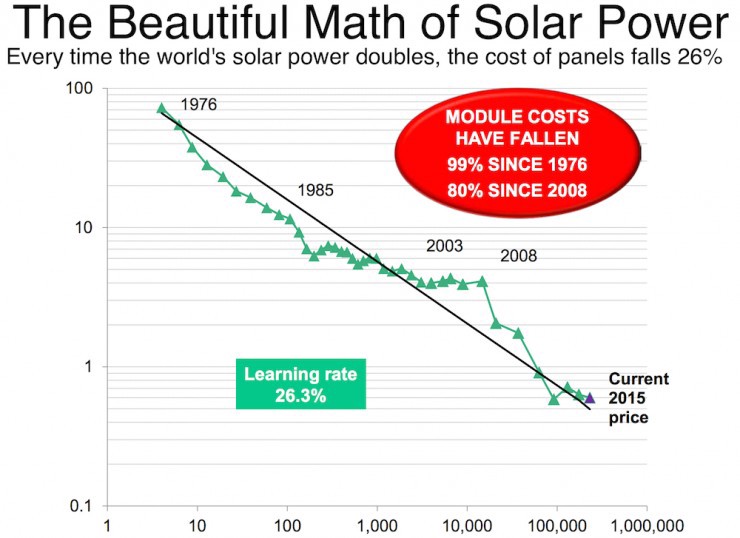
And they did continue — with especially large investments by Germany and China. The result is that over the past four decades, for every doubling in scale of the solar industry, the price of solar modules has dropped roughly 26 percent.
BNEF put the learning curve chart in its annual New Energy Outlook (NEO) from June. In a section headlined, “Solar and Wind Prices Plummet,” BNEF says “the chart below is arguably the most important chart in energy markets. It describes a pattern so consistent, and so powerful, that industries set their clocks by it.” Here it is:

The trend isn’t flattening out for renewables. That’s why BNEF concluded that the ongoing learning by solar (and wind) will make “these two technologies the cheapest ways of producing electricity in many countries during the 2020s and in most of the world in the 2030s.”
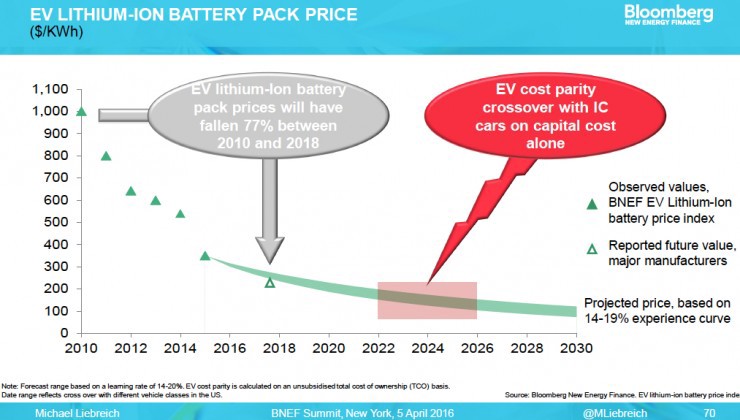
The trend also isn’t ending for batteries either, as I and others have reported. Here, for instance, is the projection from BNEF chair Michael Liebreich:

Liebreich devoted his entire must-see keynote address at BNEF’s annual conference in April to debunking the myth that somehow existing clean energy technologies were reaching limits of cost and performance and scalability. This is the myth that we need breakthrough “energy miracles” to solve the climate problem, which Bill Gates (and Revkin) have popularized.
As the 2000 EIA report concluded, “for major technologies such as photovoltaics, wind power, biomass, or heat pumps, resources provided through the market dominate the learning investments. Government deployment programmes may still be needed to stimulate these investments.”
I remain as strong an advocate for increased funding of clean energy R&D as I have been for the past 25 years. But the best way government can accelerate learning curves — the best way to avoid catastrophic climate change — is through more aggressive deployment of the key low-carbon technologies.
