JR: Here are two Climate Central pieces on the amazing heat waves that hit the country.
by Andrew Freedman, via Climate Central
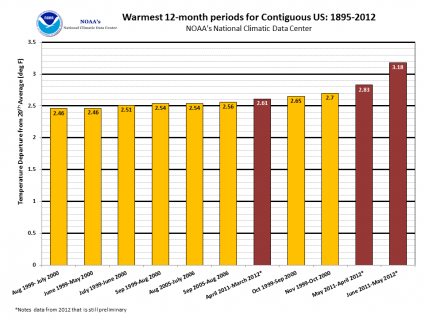
Four major heat records fell in a stunning new climate report from NOAA on Thursday. The lower 48 states set temperature records for the warmest spring, largest seasonal departure from average, warmest year-to-date, and warmest 12-month period, all new marks since records began in 1895. While the globe has been tracking slightly cooler than recent years — thanks in part to the influence of now dissipated La Nina conditions in the tropical Pacific — the U.S. has been sizzling.
The average springtime temperature in the lower 48 was so far above the 1901–2000 average — 5.2°F, to be exact — that the country set a record for the largest temperature departure for any season on record since 1895.
Spring 2012 beat 1910, which had held the title for record warm spring, by a healthy margin of 2°F. No doubt much of this was driven by the massive heat wave that gripped the country during March, but unusual warmth continued during April and May, albeit not as intense. Such warming trends are consistent with both the influence of manmade global warming, particularly the prevalence of record warm nighttime temperatures, and natural variability has also favored warmer-than-average conditions so far this year. Studies show that as greenhouse gases continue to increase in the atmosphere, the odds of heat extremes are growing as well.
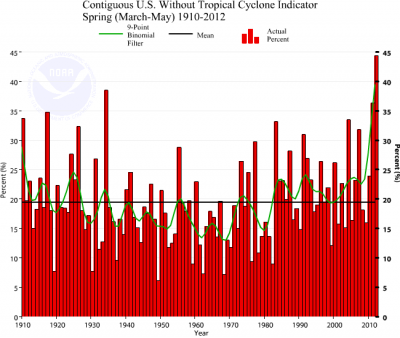
According to NOAA’s National Climatic Data Center, the spring of 2012 “was the culmination of the warmest March, third warmest April, and second warmest May. This marks the first time that all three months during the spring season ranked among the 10 warmest, since records began in 1895.”
Des Moines, Iowa offers a case study of just how warm it’s been. The year-to-date there has averaged a whopping 8 degrees F above average, with many other cities across the country tracking close to that figure as well.
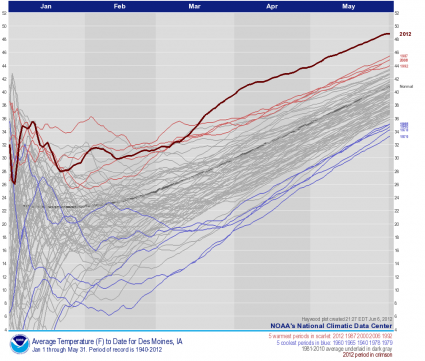
Temperature trend chart for Des Moines, IA, showing that 2012 is the warmest year to date by far. Click for a larger image. Credit: NOAA/NCDC.
Most of the states that experienced record or near-record warmth this spring were located east of the Rocky Mountains, with 31 states setting records for warmest spring temperatures. Remarkably, not a single state in the lower 48 was cooler than average this spring, and only Oregon and Washington had spring temperatures that were close to average. Although there were exceptions, much of the country had a drier-than-average spring with Colorado, Delaware, Indiana, Utah, and Wyoming coming in with a top 10 driest spring.
The record warmth helped propel the U.S. Climate Extremes Index, which tracks the highest and lowest 10 percent of extremes in temperature, precipitation, drought and tropical storms and hurricanes across the contiguous U.S., to a record-large 44 percent during the March-May period, which was more than twice the average value. “Extremes in warm daytime temperatures (81 percent) and warm nighttime temperatures (72 percent) covered large areas of the nation” were mainly responsible for this record.
Spring was unusual for the pre-season tropical weather, as two tropical storms developed before the official start of the Atlantic Hurricane Season on June 1. Tropical Storm Beryl made landfall near Jacksonville, Fla., on May 28, and brought heavy rainfall to parts of the Southeast that were in the grips of a severe drought. This year marked the third time on record that two tropical storms occurred during May in the North Atlantic Basin.
Major drought has remained elsewhere, though, and drought plus high winds led to ideal conditions for wildfires in the West. The White-Water Baldy Fire Complex in New Mexico, which was the result of two separate fires that combined into a massive conflagration, broke the record set just last year for the largest wildfire in New Mexico history.
Andrew Freedman is the Senior Science Writer for Climate Central. This piece was originally published at Climate Central and is reprinted with permission.JR: And here is a second, related, CC piece.
For Litany of U.S. Cities, 2012 Temps Are Unprecedented
by Andrew Freedman, via Climate Central
So far this year, the U.S. is running a distinct fever, as the lower 48 states had its warmest January-to-May period on record, according to the National Oceanic and Atmospheric Administration (NOAA). Other longstanding records have fallen as well, including the record for warmest spring, which dated back to 1910 and was smashed by 2°F, warmest 12-month period, and largest seasonal departure from average.
Taking a deeper dive into the temperature statistics reveals fascinating insights into just how warm it’s been at the local level in many locations. As NOAA stated on its website on Thursday, “In some locations, 2012 temperatures have been so dramatically different that they establish a new “neighborhood” apart from the historical year-to-date temperatures.”
The year-to-date numbers were certainly boosted by the unprecedented heat wave that took place during March, when several thousand warm temperature records were shattered from the Rocky Mountain states on eastward. Global warming raises the odds of heat extremes, and natural variability has favored warmer-than-average conditions so far this year as well. This has had a profound effect at the local level this year.
Take Chicago, for example. With a January-to-May average temperature that was 7.1°F above average, or 3.1 standard deviations above the 1981–2000 norm, this year so far stands in a class of its own — the warmest in the past 54 years of recordkeeping. NOAA’s chart (click on it to open a larger version) clearly illustrates this, with the bright red line depicting 2012 temperatures.
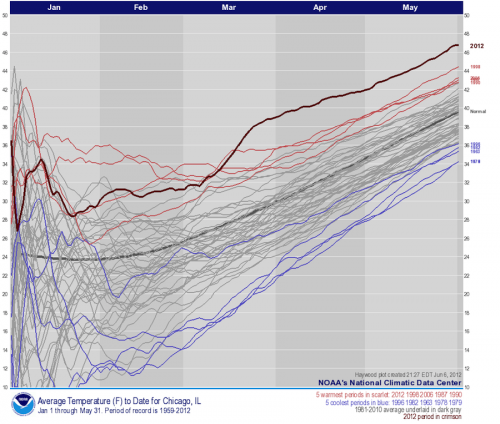
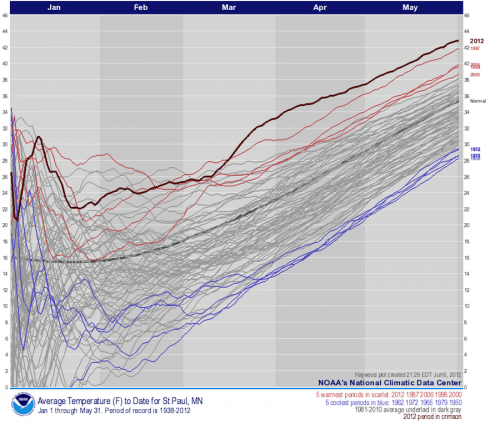
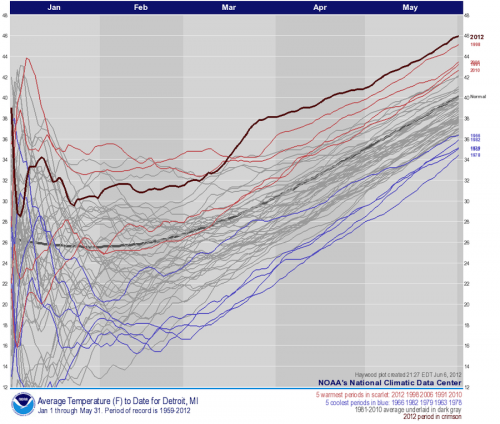
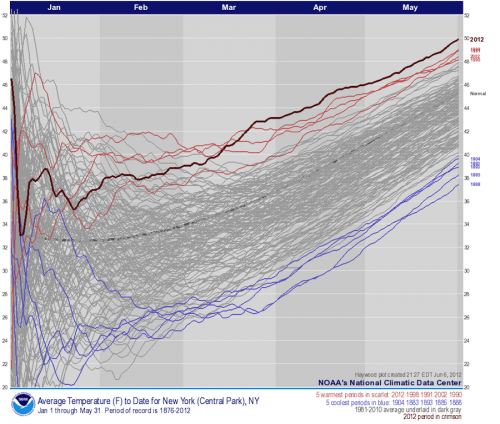
Here’s NOAA’s technical explanation for how such charts, called “Haywood Plots”, are calculated:
The unusualness is based upon the number of standard deviations difference between the 2012 value and the station’s average, based on the station’s history.
…As you read from left to right, a particular year’s trace represents the average of all previous days during that year. For this reason, these plots are often very noisy early in a period (towards the left), but they provide an outstanding representation of unusualness over the whole of the period.
Here’s what the chart looks like for St. Paul, Minn., where the January-to-May period came in at 7.5°F above average, for the warmest in 74 years of recordkeeping there.
It was a similar story in Milwaukee, where January-to-May temperatures were 6.2°F above average, or 2.8 standard deviations above the norm. This made it the warmest such period in 71 years of recordkeeping.

In Detroit, January-to-May temperatures averaged 5.8°F above average, or 2.9 standard deviations above the norm, for the warmest such period in 54 years.
Lastly, in New York City’s Central Park, where weather records extend further back than at some Midwestern stations, the January-to-May period was 4.7°F above average, making it the warmest such period in 137 years.
Additional data is available from NOAA’s website, showing how temperatures compared at other cities across the country. There were precious few places that had cooler-than-average temperatures so far this year, the vast majority of them located in the West and Northwest. One exception is Portland, Maine, which somehow beat the heat — with an average temperature of 0.7°F below average. Portland residents can probably thank the cold waters of the Atlantic Ocean for that.
— Andrew Freedman. This piece is reprinted with permission.
Related Climate Progress Posts:
